Most fraud teams I’ve seen are set up as a cost center: an allocated budget, a mandate to keep losses under some number, and an implicit assumption that every dollar spent on controls is a dollar of friction imposed on the business. Framed that way, the team’s incentives point in exactly one direction — minimize loss — while Growth and Product’s incentives point in the other — minimize friction. Nobody designed this conflict on purpose. It falls straight out of how the two teams are each measured.
I’ve watched this play out a few times, in different shapes.
A note before the examples below: they’re composited from patterns I’ve seen across multiple companies and teams, with identifying details changed - none of them describe a single real event, decision, or employer.
At one company, the risk team stood up a step-up device re-verification check — a one-time push confirmation to a trusted device — for applicants flagged as risky. By the numbers the risk team had — precision, recall, loss avoided — it looked like it was working well. Product and Growth came to a different conclusion: the tool caused too much friction, and good customers were dropping off during it. Neither side, as far as I know, had actually quantified the other half of the picture — the risk team could point to loss avoided but hadn’t sized the drop-off, and product’s drop-off concern was more a sense that friction was costing signups than a measured number. What we do know is that identity theft losses at that company ran well into the thousands of dollars per instance, which at least sets a scale for how large the drop-off would’ve needed to be to genuinely outweigh it. Nobody on either side of that debate was wrong to care about their half of the tradeoff — the actual gap was that neither half had been measured against the other.
At another, the concern was velocity limits on payment-method additions — a control that holds a new card for review if it’s the third or fourth one added to an account within a short window, a pattern common in card-testing rings. The theory Product pushed was intuitive enough: legitimate customers split bills, replace expired cards, or add a partner’s card in the same week, and holding those adds would just push them to a competitor. That’s a reasonable hypothesis on its face — card churn is real, and friction on a mundane action can plausibly drive it. The issue wasn’t that the concern was illegitimate; it’s that the case for it stayed anecdotal, with no quantitative look at what actually happened to customers whose card additions were held versus the losses avoided by holding them. Nobody had built the comparison either direction.
At a third, the biggest source of loss was account takeover, and the most effective signal for catching it was flagging logins from a device and location that didn’t match the account’s established pattern — takeover attempts show up as a geographic and device jump almost every time. Product’s read was that the geolocation check itself caused too much friction for travelers and remote workers and needed to go, signal or not. Again, a legitimate concern about a real cost (friction, drop-off) running up against a real cost on the other side (fraud loss), without a shared way to weigh the two against each other.
Three different companies, three different controls, the same shape every time: a friction concern on one side, a loss number on the other, and no shared, quantified way to compare them. I’m not trying to relitigate any of these three specific calls, and I don’t think either side was being unreasonable — friction is a real cost and fraud loss is a real cost, and reasonable people can disagree about the tradeoff. The problem is structural, not personal: in a cost-center framing, Growth owns conversion, Fraud owns loss, and the budget line makes it look like a zero-sum fight between two teams instead of one shared optimization problem neither team had the tools to solve together.
The baseline that’s missing from the conversation Link to heading
The number that never showed up in any of these debates is the one that actually matters: what would profitability look like with no controls at all? Not “how much friction are we causing,” but “what’s the loss rate, and the resulting unit economics, if this control didn’t exist” — the counterfactual. Once you have that number, the conversation changes shape. The control isn’t a cost imposed on the business; it’s the difference between the no-controls baseline and where you actually are. Performance isn’t “did we hit our loss target” — it’s “how much better than the baseline are we this quarter, and is that improving.”
Getting that number depends on the control. Where it’s feasible — legally, operationally, and without taking on loss you can’t tolerate — the cleanest way is a live holdout: a slice of traffic that never sees the control, so the counterfactual is measured continuously instead of estimated. Not every control can run that way; some carry too much downside to hold back even a small population, and for those the baseline has to come from a retrospective calculation instead — modeled off the pre-control period, or off a comparable population the control doesn’t reach. Neither approach is universally right; which one you use is itself a judgment call about the control’s risk, not a fixed rule.
That reframing does three things. First, it puts Growth’s friction argument and Fraud’s loss argument on the same footing — both have to show their work against a shared, quantified counterfactual instead of trading anecdotes. Second, it kills the incentive to over-optimize on recall. A team measured purely on “loss avoided” will happily block friction-heavy, low-value signups all day, because every additional block looks like a win on their scorecard even when it’s destroying more value than it protects. A team measured against the baseline has to net out what it’s costing, not just what it’s catching.
Third, and maybe most important, it lets the team optimize for the business as a whole instead of a departmental proxy for it. Almost every team ends up managed on some sub-goal — a loss rate, a conversion rate, an approval rate — chosen because it’s legible and ownable, with the hope that hitting it moves the company-wide number in the right direction. Usually it does. But a proxy metric and the thing it’s a proxy for can quietly diverge, and when they do, a team can hit its number while the business is worse off for it. A loss-rate target is a proxy for profitability; it’s a good one most of the time, which is exactly what makes it easy to stop questioning. Optimizing directly against portfolio value sidesteps the translation step entirely — there’s no proxy to drift away from what the business actually cares about, because the metric already is what the business cares about.
This isn’t hypothetical — it’s one of the most consistent patterns I’ve seen, across more than one company and more than one team I know: a fraud attack hits, loss spikes, and the team finds itself at or over its annual loss budget because of that single event. The natural response, understandably, is to want to stop the number from climbing any further, and the fastest lever for that is maximizing recall. Precision constraints tend to loosen in that moment — not out of carelessness, but because the metric everyone’s watching in that moment is the loss total, not the value the control is actually protecting. That’s not really a people problem; it’s what a fixed-budget framing produces almost by design. The budget is the thing being managed, so a bad quarter creates real pressure to trade away precision that wouldn’t be acceptable under normal conditions. Measured against a baseline instead of a hard-capped budget, the same attack is still bad news, but the question shifts: is the marginal recall being bought still worth what it’s costing in false positives, not just whether the loss number stops going up.
Part of what makes that response so common is that the budget being defended usually wasn’t derived all that rigorously to begin with — through no fault of the people setting it. Loss budgets typically get set once a year — some percentage of revenue, or a flat dollar figure, negotiated between finance and risk and then largely held until the next planning cycle. That’s a reasonable way to plan a year, but the number rarely comes from anything like the break-even economics above; it’s more often last year’s figure nudged for growth, a defensible round number from a planning meeting. And a single annual figure can’t easily flex with what actually happens over the year: new products launch, new channels open up, the customer mix shifts, each bringing its own risk profile the budget never priced in. Precision-based, per-decision economics sidestep that problem, because they scale automatically with whatever’s actually being originated this week instead of being fixed months in advance.
The break-even precision floor Link to heading
That’s where a break-even precision threshold comes in — the minimum precision a control needs to hit before it’s worth running at all, given the actual economics of what it’s protecting. The two numbers that drive it are the cost of a false positive and the cost of a false negative, and they’re rarely the same kind of cost:
- Cost of a false positive (FP) — the control flags a good customer. You lose their LTV: the margin they’d have generated had the friction not pushed them to drop off or churn.
- Cost of a false negative (FN) — the control misses an actual fraudster (or, equivalently, you run no control at all and they walk straight through). You eat the full identity-theft / first-party-fraud loss.
Roughly:
break-even precision ≈ cost_of_false_positive
                        ──────────────────────────────────────
                        cost_of_false_positive + cost_of_false_negative
Here’s a worked, illustrative version of the device re-verification example above, with made-up but realistic numbers. Say the business gets 5,000 new applicants a day, the raw fraud rate on new applicants is 2%, a false positive costs $250 (the lost LTV of a good customer the control drives away), and a false negative costs $4,000 (the average identity-theft/first-party-fraud loss when a fraudster gets through). With no control at all, every fraudster in the pool is a false negative by default, so the daily portfolio value is just legit LTV minus fraud losses:
cost_of_false_positive = 250    # lost LTV of a good customer wrongly flagged
cost_of_false_negative = 4000   # avg loss when an actual fraudster gets through
daily_applicants = 5000
raw_fraud_rate = 0.02           # share of daily applicants who are fraudsters

legit_applicants = daily_applicants * (1 - raw_fraud_rate)
fraud_applicants = daily_applicants * raw_fraud_rate

# LTV per legitimate customer that comes through cleanly
ltv_per_legit_customer = 250

# no control running -> every fraudster is a false negative
baseline_value = legit_applicants * ltv_per_legit_customer - fraud_applicants * cost_of_false_negative
# baseline_value = 4,900 * $250 - 100 * $4,000 = $825,000/day
Now say a step-up device re-verification control is running against that population. Its two operating stats are precision (of everything it flags, what share is actually fraud) and recall (of all the fraud that exists, what share it catches). True positives and false positives both fall out of those two numbers together:
precision = 0.06  # try any value between 0 and 1
recall = 0.80      # try any value between 0 and 1

true_positives = recall * fraud_applicants           # fraud actually caught
false_positives = true_positives * (1 - precision) / precision  # good customers wrongly caught

value_with_control = baseline_value + (
    true_positives * cost_of_false_negative - false_positives * cost_of_false_positive
)
Recall turns out to only set the magnitude of the swing — how much value is on the table — while precision alone decides whether that swing is positive or negative. Setting value_with_control equal to baseline_value and solving shows why: the recall term factors out entirely, leaving precision = cost_of_false_positive / (cost_of_false_positive + cost_of_false_negative) = 250 / (250 + 4000) ≈ 5.9%, regardless of recall. Below that precision, catching more fraud (higher recall) actually makes things worse — you’re just scaling up a control that destroys value per flag. Above it, more recall is straightforwardly better:
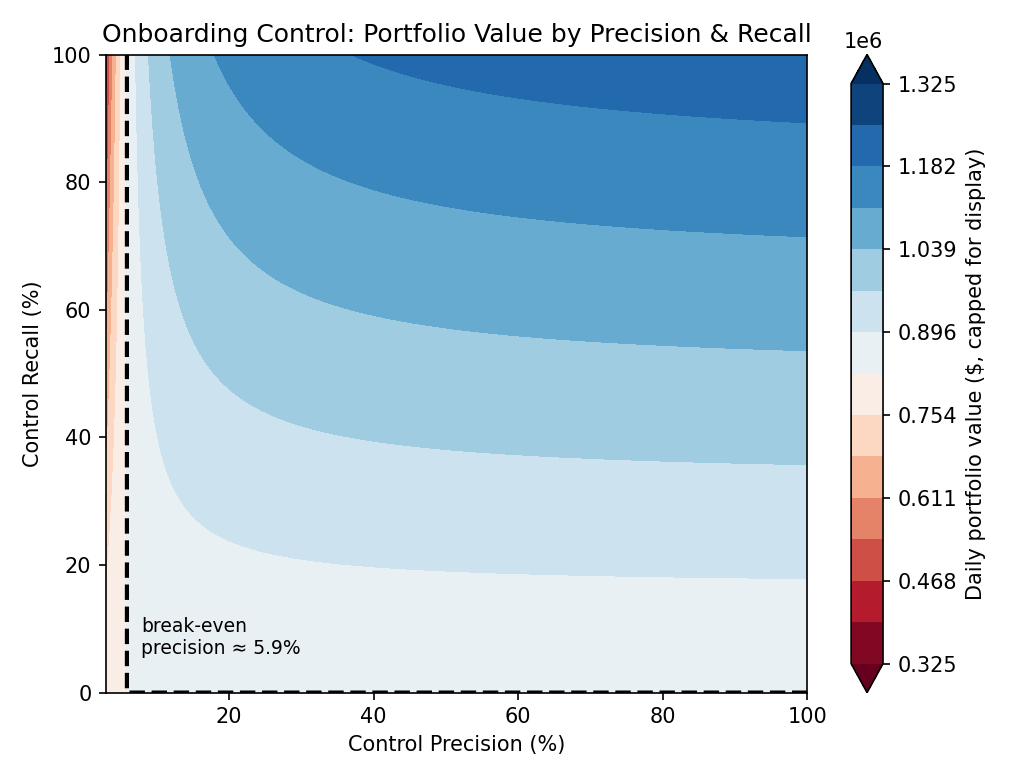
That’s the shape worth internalizing: the break-even boundary runs almost straight up and down at ~5.9% precision, while the value bands around it curve — because at any fixed precision above break-even, more recall keeps adding value, and at any fixed precision below it, more recall just loses more of it faster. A control running anywhere near 5.9% precision would be unusual — most fraud controls with real signal clear well above that, which is exactly why the device re-verification example above should have been an easy call: at $4,000 a loss, the break-even bar is low enough that only a genuinely weak signal would fail to clear it. The friction argument needed a precision estimate to be a real argument, not just a felt sense that customers were dropping off.
This isn’t an argument that friction never matters — a control can clear break-even and still be worth tuning down if a cheaper, less-invasive alternative gets you close to the same recall. It’s an argument that “this feels like too much friction” isn’t itself a finding. It’s a hypothesis that needs the same rigor as the loss number sitting across the table from it.
Where this doesn’t apply Link to heading
This whole framework leans on LTV being something worth protecting — the reason a false positive is costly is that the customer it turns away was net-positive value. That assumption doesn’t hold everywhere. A company in a genuine grow-at-all-costs stage isn’t optimizing for LTV at all; it’s optimizing for customer count, and it may be entirely willing to run negative unit economics to get there. In that world, a false positive’s “cost” isn’t a lost margin, because there was no margin being protected in the first place — the whole calculus this post is built on doesn’t apply. That’s a different, and much narrower, situation than most of the companies this post is written for. Most mature startups and established companies aren’t in that phase, and for them, LTV is real and worth defending. But it’s worth naming the boundary rather than pretending the framework is universal.
None of this is even a new idea, really — Growth teams have been doing the LTV-side version of it for years. Nobody funds a marketing channel against a flat dollar cap with no regard for what it returns. They look at CAC payback: does the cost to acquire a customer get paid back by their LTV within some reasonable window. Spend goes up, CAC creeps, and nobody panics as long as payback still clears. Fraud is the same math pointed the other direction — instead of asking what it costs to acquire a customer, you’re asking what it costs to wrongly turn one away, or to let a bad one in. If Growth already gets to run on payback instead of a hard-capped budget, I don’t see why fraud shouldn’t get the same treatment.
The point Link to heading
None of the examples above — the three friction fights or the recurring loss-budget response — were about one side having better instincts than the other. They stayed unresolved, or got resolved on vibes, because neither side was arguing from the same baseline, and in the budget case, because the metric itself (a hard-capped loss number) was the wrong thing to manage to in the first place. A cost-center framing structurally sets up both outcomes — it hands each team its own scorecard, lets them optimize locally, and then invites overcorrection the moment that scorecard gets breached. A profitability-baseline framing doesn’t make the tradeoffs go away, but it does force every side of the argument to price their case in the same currency, and it gives whoever’s actually done the quantitative work — friction or loss, Growth or Fraud — something sturdier than “trust us” to stand on.